By Calvin Hexter + Calvin Realty
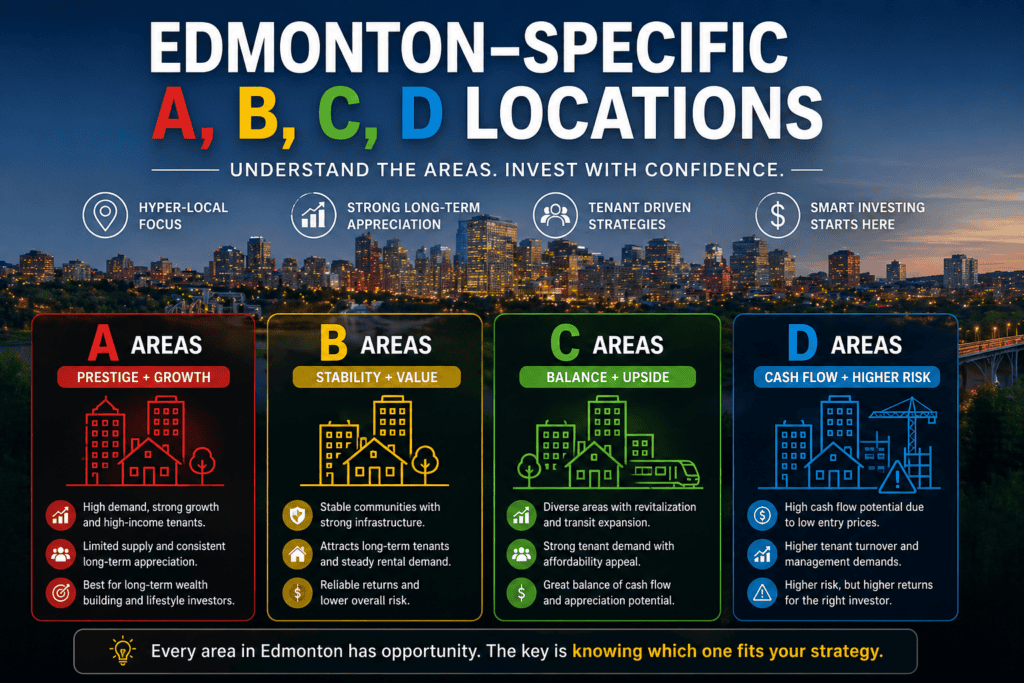
A LOCATIONS (Edmonton Examples)
Examples:
- Glenora
- Crestwood
- Windermere
- Strathcona (select pockets)
- Belgravia
These are your prestige + lifestyle-driven areas.
What actually happens here
These areas are driven by:
- Proximity to river valley
- Walkability + amenities
- High-income demographics
Investor truth
- You are not buying cash flow
- You are buying land value + long-term appreciation
Rental strategy in Edmonton
- Executive rentals
- High-end long-term tenants
- Airbnb (only in very specific pockets)
Important: Edmonton is not a pure short-term rental market like Toronto or Vancouver. You need to be selective.
B LOCATIONS (Edmonton Sweet Spot)
Examples:
- Terwillegar
- Summerside
- Secord
- Allard
- Capilano
This is where most investors should be
Why?
Because Edmonton has a huge advantage here:
👉 Legal basement suites
What that means
You can take a B property and turn it into:
- 2 income streams
- Strong DSCR support
- Better financing outcomes
Typical performance
- Rent upstairs: ~$1,700–$2,200
- Basement: ~$1,100–$1,400
This is why Edmonton quietly dominates cash flow.
C LOCATIONS (Cash Flow + Value Add)
Examples:
- West Jasper
- Westwood
- Canora
- Inglewood
What makes these areas interesting
- Lower entry price
- Higher rent-to-price ratio
- More upside through improvements
Where investors win
- Suite conversions
- Renovations
- Increasing NOI
Student housing angle
Works well if:
- Close to NAIT
- Close to transit
This is where room rentals and multi-tenant strategies can outperform.
D LOCATIONS (High Risk Zones)
Examples:
- Alberta Ave
- Eastwood
- McCauley
- Boyle Street
- “The Black Triangle”
The reality most people won’t say
These areas are:
- Transaction-heavy
- Investor-heavy
- Problem-heavy
What actually happens
- High advertised returns
- High vacancy
- High turnover
- High management intensity
This is where inexperienced investors get burned.
COMPARISON TABLE
Performance Snapshot (Edmonton-Based)
| Metric | A Areas | B Areas | C Areas | D Areas |
|---|---|---|---|---|
| Avg Price | $700K+ | $450K–$650K | $300K–$450K | <$300K |
| Cash Flow | Low | Moderate | High | Very High (unstable) |
| Tenant Quality | Excellent | Strong | Mixed | Risky |
| Vacancy | Very Low | Low | Moderate | High |
| Appreciation | Strong | Strong | Moderate | Weak |
| Cap Rate | 4–5% | 5–6% | 6–8% | 8–10%+ |
| Management | Low | Moderate | High | Very High |